
The Reliability Threshold: Why AI Adoption in Operations Is Binary
A tool either crosses the point where people stop checking its work, or it becomes one more screen someone double-checks by hand. That point is set by the cost of a mistake.
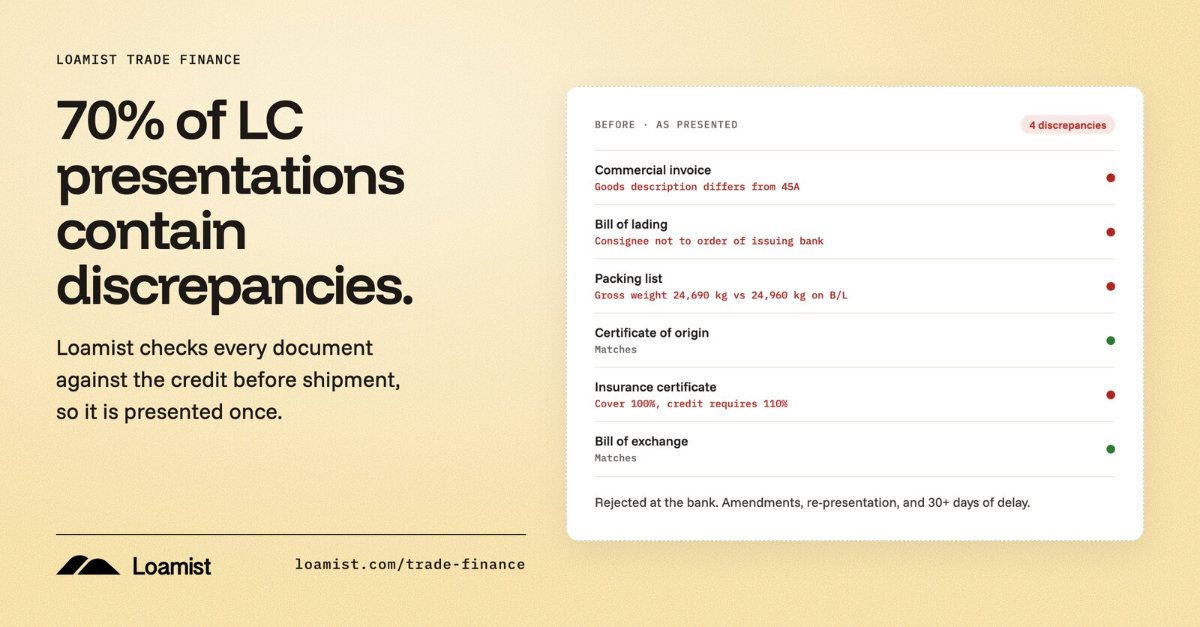
Operations teams do not adopt automation a little at a time. A tool either crosses the point where people stop checking its work, or it becomes one more screen that someone double-checks by hand.
That point is the reliability threshold. Every industry has one, it is set by the cost of a mistake, and it explains why so many AI pilots look promising and then quietly stop.
What a reliability threshold is
A reliability threshold is the accuracy at which a team can act on an output without reviewing it. Below the threshold, every result still goes to a person, so the business pays for the tool and for the human check. Above it, only the exceptions go to a person, and the savings arrive.
The threshold is determined by three numbers: what one wrong decision costs, how many decisions the team makes, and what it costs to check one. When an error is expensive and the volume is high, the bar is close to perfect.
The bar moves with the cost of a mistake
Look across industries and the pattern is the same, even though the numbers differ.
- Trade finance. Under UCP 600, when banks examine documents, one discrepancy can be enough to refuse a whole presentation. The ICC Banking Commission has put first-presentation refusal rates between 65% and 80% for years. A pre-check that misses one discrepancy in ten does not reduce that risk.
- Payments. Banks measure straight-through processing by the share of payments that need no human touch. A payment that fails a check drops out of the automated flow and into a queue, so a small error rate turns into a large manual workload.
- Manufacturing. Quality programmes count defects per million because each failure creates costs such as scrap, rework, downtime, warranty claims, returns and recalls. Six Sigma targets 3.4 defects per million opportunities. At one million opportunities, a 1% defect rate produces 10,000 defects. If each defect costs $100 to correct, the total cost is $1 million, compared with $340 at the Six Sigma target.
- Freight and logistics. Industry estimates attribute approximately 3% to 7% of freight spend to billing errors, while manual invoice processing can cost about $10 to $15 per invoice. Suppose reviewing a flagged invoice costs $15 in labour and the suspected overcharge is $10. Even when the flag is correct, the company spends $15 to recover $10. If only half the flags are correct, the expected recovery falls to $5 per review. The audit tool creates value only when it suppresses low-value exceptions and is reliable enough for the team to accept unflagged invoices without checking them again.
- Utilities and land. Siting a facility, clearing vegetation near power lines or planning a treatment programme commits money, crews and permits for years. A model that is right most of the time still needs every decision reviewed, because the cost of the wrong site is not recovered.
- Biotech and FDA filings. An FDA application seeking approval to sell a new drug may represent the final step in a development programme involving more than $1 billion in capitalized R&D. Yet an apparently minor filing defect can stop the submission before scientific review begins. FDA classifies certain electronic-submission defects, such as a missing trial-summary dataset or required data-definition file, as high-severity errors. One such error can cause the submission to be treated as not received and require resubmission. For an automated filing check, the reliability threshold is therefore effectively 100% on rejection-level criteria. A system that catches 99 out of 100 of these defects still cannot replace expert release review, because the one miss can delay a programme whose development cost and future revenue are measured in billions.
In each case the threshold sits in the high nineties or above, and in each case the people doing the work can tell you, without a spreadsheet, whether a tool is above it.
Why adoption is binary
Take a letter of credit presentation with 200 checks across its documents. A tool that is 90% accurate gets about 20 of those wrong on every presentation. The examiner cannot know which 20, so they review all 200. The tool has saved nothing, and it has added a second opinion to argue with.
At 98% the same presentation has about four questionable results, and at 99% about two. Now the examiner reviews the findings, not the whole set, and the time per presentation falls sharply. The value of automation does not rise smoothly with accuracy. It stays near zero until the threshold, then rises steeply once a team can trust the output.
Trust adds a second step. One missed discrepancy that reaches the bank, or a week of incorrectly flagged findings that turn out to be nothing, and a team goes back to checking everything. A tool can lose its users far faster than it gained them, which is why near-threshold tools so often stall after the pilot.
Average accuracy is the wrong number
Most AI accuracy figures are averages from one evaluation run. Operations do not run once. The same kind of document arrives every day, and a team experiences the bad days, not the average.
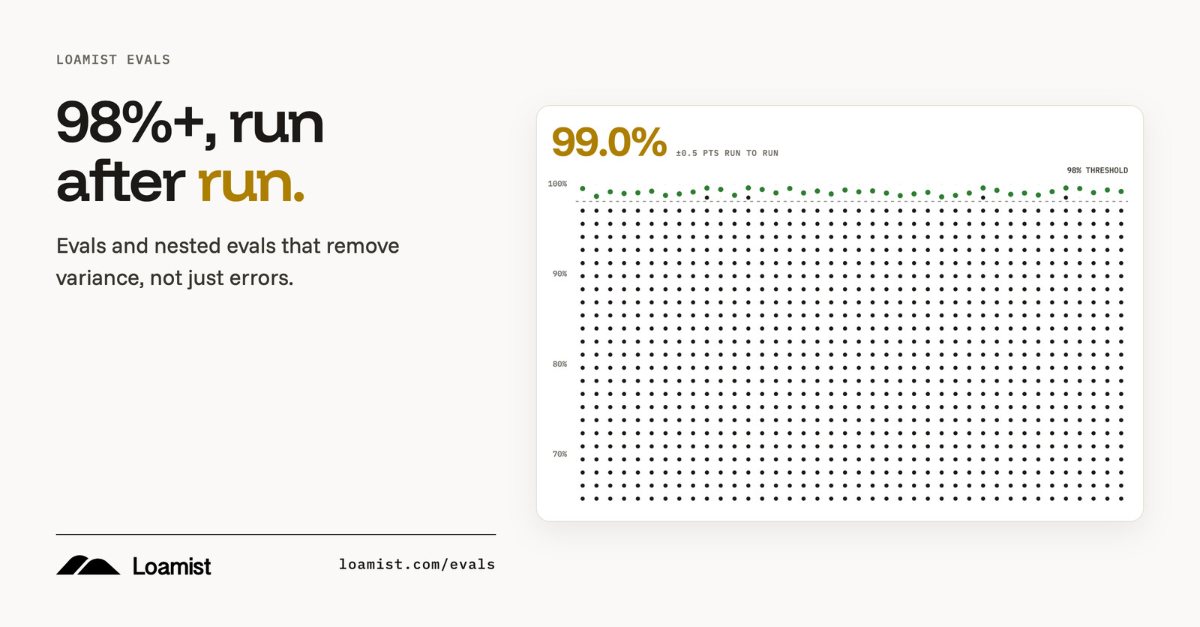
Language models are not deterministic: run the same task twice and the answers can differ. A system that averages 97% but swings between 90% and 99% from run to run is below the threshold in practice, because the team cannot tell in advance which run it is getting. The figure that matters is the floor: the accuracy you can count on, run after run.
How we measure ours
Loamist holds 98%+ accuracy, run after run, in production. In trade finance, our L/C pre-check runs at 99% accuracy on live transactions. These are the principles behind those numbers, and they apply to any team evaluating an AI system:
- Set the threshold before building. Define the decision, what a mistake costs, and the accuracy the team needs. Then build to it, not the other way round.
- Measure on real work. Use the documents and decisions the team actually sees, with the outcome known, not a curated demo set.
- Run it more than once. Repeat the same evaluation and report the spread, not only the mean. A threshold that holds on one run and not the next is not a threshold.
- Count both kinds of error. Missed problems and phantom findings both send work back to a person. Track them separately.
- Check the checks. Evals tell you whether the system is right; evals of those evals tell you whether the measurement itself can be trusted.
- Show the reason. Every finding should point to the document, the field and the rule behind it, so the rare miss takes seconds to correct rather than an hour to investigate.
Key takeaways
- Every operation has a reliability threshold, set by the cost of a mistake: below it, people re-check everything; above it, they act on the output.
- Adoption is binary because value stays near zero until a team can trust the result, then rises steeply.
- The number that matters is the floor across repeated runs, not the average of one.
- Loamist holds 98%+ accuracy, run after run, and 99% pre-check accuracy on live L/C transactions.
Have a decision that needs to be right every time? Book a working session, or run a free L/C check on one of your own credits.
Frequently asked questions
What is a reliability threshold for AI?
It is the accuracy at which a team can act on an AI system's output without reviewing it. Below it, every result still goes to a person; above it, only the exceptions do. The threshold is set by what a mistake costs, how many decisions the team makes, and what it costs to check one.
Why is AI adoption binary?
Because the value of automation stays near zero until people can trust the output. A tool that is 90% accurate on 200 checks gets about 20 wrong, so the team still reviews everything. Once accuracy crosses the threshold, the team reviews only the findings and the time saved rises steeply.
How does Loamist measure 98%+ accuracy?
On real work with known outcomes, repeated across runs so the floor is measured rather than one average. Missed problems and phantom findings are counted separately, the evals themselves are checked, and every finding cites the document, field and rule behind it.
Have a decision that needs to be right every time?
Bring one decision your team makes every day. We will measure where your threshold is and show what it takes to hold it, run after run.
Run a free workability check on a recent L/C, or book a demo and we will walk through a live decision trace.

Andy leads engineering and the agent architecture at Loamist. A bioengineer and full-stack technologist with 18 patents, he writes about how document intelligence is built and why explainability matters in trade finance. Connect with Andy on LinkedIn, or follow Loamist for the short version of each post.